Loading...
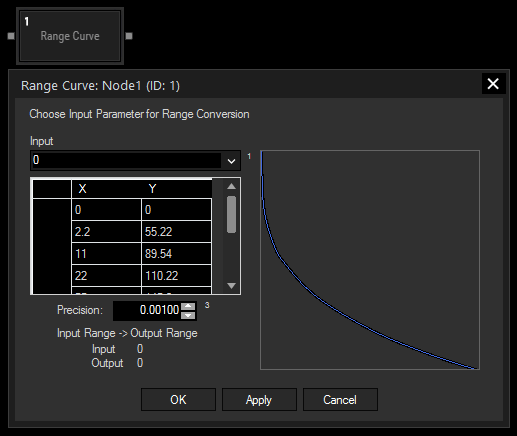
The Range Curve filter node allows assigning any input value to a new output value, where the mapping of input to output is defined by a non-linear function. For defining this function, X and Y coordinates of points can be set and will be automatically connected by a smooth curve. The input value represents the X coordinate of a point on the curve, the output value respectively the Y coordinate of the same point.
It is for example helpful to transform the linear value distribution of a Fader widget to the logarithmic scale of a PB Device Volume fader (see below Example 2).
The node can be found under Nodes > Filter Nodes > Range Curve

Input:
Choose an input node from the drop-down or enter a numeric value that will be mapped on the X axis.
Set Points:
Enter here the X and Y coordinates of the points for defining the mapping function. Please bear in mind that the X coordinates need to consecutively follow each other from smallest to largest value if you want to avoid loops (and thus inconclusive mapping of one input to several output values).
The curve at the right side of the dialog displays the graph derived from the entered points and is being updated with each new coordinate. The positive X axis goes to the right, the positive Y axis to the bottom, a maximum of ~220 is visible for each.
Larger values are not displayed, but are taken into calculation of the curve.
Precision:
Enter here the precision with which the curve should be written. It is recommended to set the precision to at least as much as your most precise result is required to be, e.g. two decimals.
The image above pictures a curve derived from a simple gamma curve with γ = 0.3, normed on input values from 0 to 220 for a more significant display:
Y = (X/220)0.3 * 220
The more points are given for the Range Curve node, the more exact the result will be. In this case, a selection of X and Y value pairs was calculated with the above equation and added as points to the node:
X |
Y |
0 |
0 |
2.2 |
55.22 |
11 |
98.54 |
22 |
110.22 |
55 |
145.2 |
110 |
178.64 |
165 |
201.74 |
220 |
220 |
Input values that now arrive as X value of the equation will be mapped and outputted as the respective Y equivalent, e.g.:
Input: 78.64
Output: 161.17 (exact value using the equation for calculation: 161.58)
The outputted result deviates from the actual result, but with more points and more precise coordinates (i.e. more decimals), it will also converge more.
Linking a linear Fader widget with a logarithmic (dB) Volume fader in PB
Volume Faders in PB can be found in Audio Track or Video Layer Device Parameters.
The needed input values of a Volume Fader range from 0 to 2, those values will be converted within PB into the logarithmic dB values you can see at the label (please refer to the chapter Volume for more information about the value conversion).
If you simply use the Fader widget's own Control option, select the respective Device and Volume parameter and set the Minimum to 0 and the Maximum to 2, you will see that the movement of the WD Fader and the movement of the PB fader do not conform, due to the logarithmic calculation.
If you want both movements to be identical, you need to send the values already with a logarithmic distribution from WD. This is how you can easily achieve it:
1. Create a Fader widget, set the Minimum to 0 and the Maximum to 100.
2. Create a Fader Input node and link it to the Fader, connect this to a Range Curve filter node and connect this to a PB Device Parameter output node.
3. Select the Fader input node as Input in the Range Curve Node and apply the following values to the table:
X |
Y |
0 |
0 |
12.5 |
0.03125 |
25 |
0.125 |
50 |
0.5 |
75 |
1.125 |
100 |
2 |
4. Open the Device Control node, set up the Device and Parameter you would like to address and choose the Range Curve node as input value.
5. Enjoy!
With Widget Designer version 6, all nodes support so called node commands. Node commands access functions (i.e. methods) from a node and / or set a parameter (i.e. property).
Enter "node", followed by the according ID and a dot and a list will pop up showing all available commands for the node. For instance, Node1.TintColor.SetRGB(125,0,255), colors the node in purple.
In addition, the node properties with a parameter ID (the small superscript number) can be edited via the command Node1.SetParam(ID,new Value) or WDNodeSetParam(NodeID,ParamID,Value).
The Node generates the following output:
- Output